

Net worth shows what you’ve built, but liquidity, cash flow and debt decide how much freedom that wealth gives you when life asks for a decision.
Key Takeaways
- Net worth and liquidity measure different things. A household can hold substantial assets and still have limited cash for near-term needs.
- Cash flow shows what a balance sheet can’t. A high income doesn’t guarantee a household is building flexibility.
- Debt needs context. The right amount depends on income stability, liquidity, interest costs and goals.
- Common benchmarks are starting points, not grades. Ratios like 3–6 months of reserves or a 36% total debt ratio help frame better questions.
Imagine a household with a $3 million net worth.
They own a beautiful home, have substantial retirement savings and hold company stock that has appreciated considerably. Their income puts them among the highest-earning households in the country.
On paper, they look great.
A closer look raises some questions. Most of their wealth sits in the house, the retirement accounts and employer stock. Their spending has grown right alongside their income. They carry a large mortgage, tuition bills are coming, and there isn’t much cash available without selling investments or triggering taxes.
They’re wealthy. But how much room do they actually have to move?
That’s why comprehensive financial planning involves more than adding up assets and subtracting liabilities. Net worth matters, but it’s one measure of financial health. How money moves through a household, and what happens when that movement changes, can tell a very different story.
Sometimes the most important question isn’t how much you have. It’s how much room you have to make a decision.
What Does Net Worth Tell You, and What Doesn’t It?
Net worth tells you what you own minus what you owe on a single date. It’s calculated from a personal balance sheet, also called a statement of financial position, and it’s best read as a snapshot rather than the full picture.
Net worth = Total assets − Total liabilities
Assets can include cash, investments, retirement accounts, real estate and business interests. Liabilities include mortgages, loans, credit card balances and other debts. Tracked over several years, net worth is a useful way to measure progress. On its own, it has blind spots.
Here’s our hypothetical household:
| Assets | Value |
|---|---|
| Primary residence | $1,500,000 |
| Retirement accounts | $1,100,000 |
| Employer stock | $800,000 |
| Taxable investments | $350,000 |
| Cash and savings | $50,000 |
| Total assets | $3,800,000 |
| Liabilities | Balance |
|---|---|
| Mortgage | $750,000 |
| Auto and other loans | $50,000 |
| Total liabilities | $800,000 |
Net worth: $3,000,000
That’s meaningful wealth. Only $50,000 of it is sitting in cash.
This doesn’t mean the household is in trouble. They may have accessible taxable investments, predictable income and a solid plan for upcoming expenses. The balance sheet alone just can’t tell us whether they’re ready for a major cash need. For that, we need to look at what kind of assets they hold, not only what they’re worth.
What Is Liquidity, and Why Does It Matter?
Liquidity is how quickly and easily an asset can be turned into cash without losing value or creating other unwelcome consequences. An asset’s value and its usefulness for paying a bill next month are not the same thing.
Cash in a savings account is highly liquid. A house isn’t. Selling one takes time and money, and it’s rarely a practical answer to an unexpected expense.
Retirement accounts can hold substantial wealth, but tapping them early may bring taxes, penalties or long-term costs. Employer stock comes with its own fine print: trading windows, vesting schedules, concentration risk and tax consequences when sold. Private-company equity can be harder still to convert.
How Much of This Wealth Is Ready to Use?
Sorted by how quickly each asset can become cash, $3.8 million in assets looks very different.
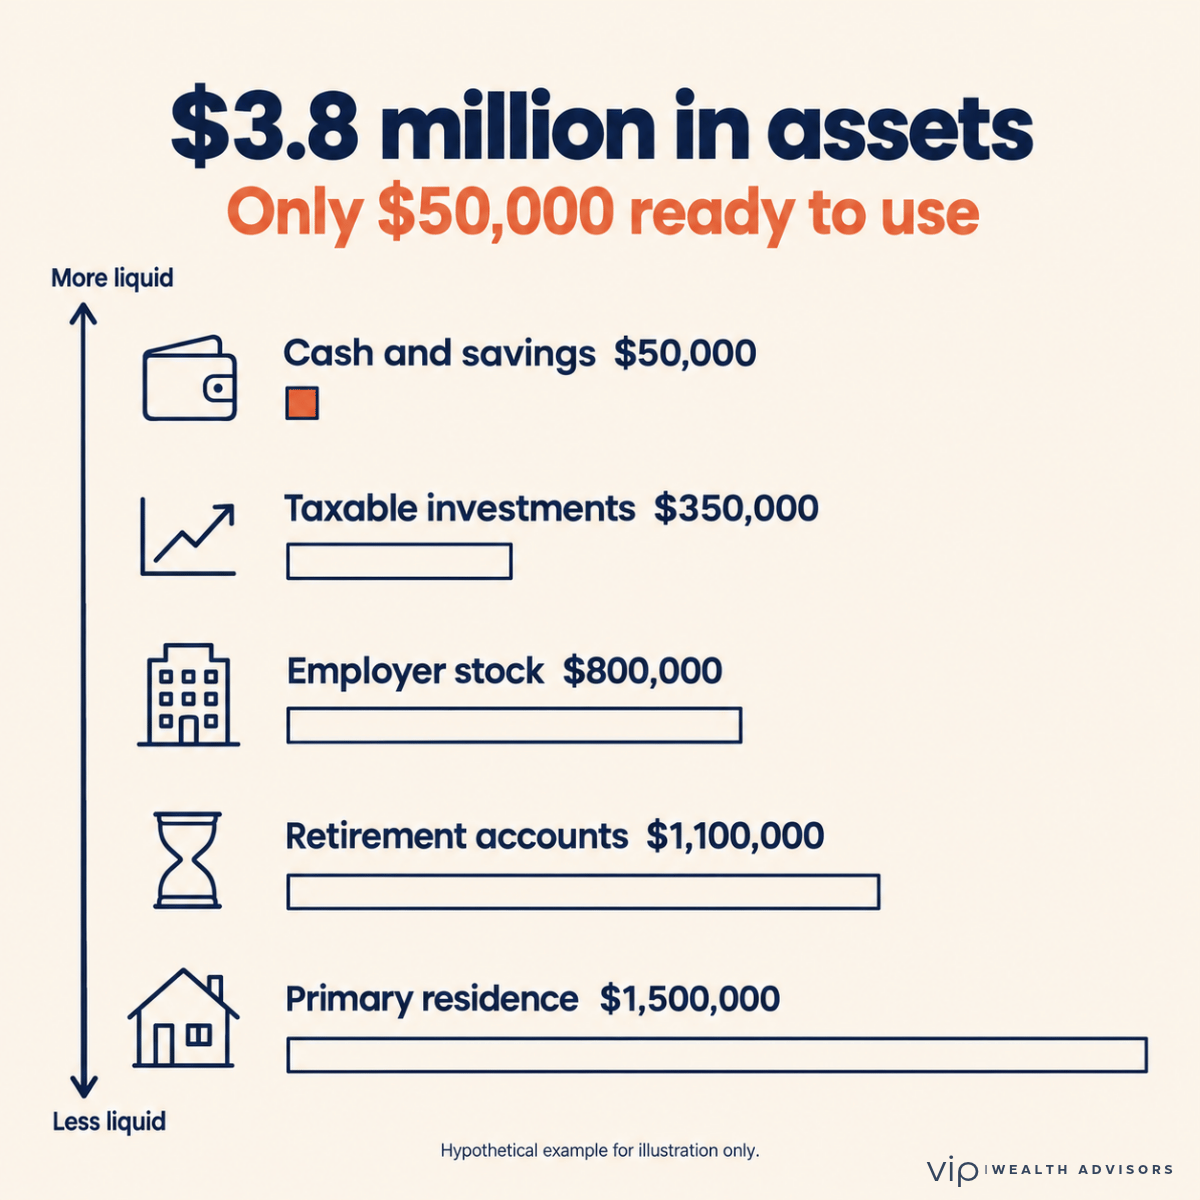
Now imagine our household faces a $100,000 expense. Maybe it’s a tax bill after an equity compensation event or an unexpected family need. They could use savings, sell taxable investments or borrow, and each choice touches something else. Selling may create capital gains or shift the portfolio’s allocation. Borrowing adds interest and a repayment schedule. Draining cash leaves them exposed to the next surprise.
The planning question isn’t whether $100,000 exists somewhere on the balance sheet. It’s which source makes the most sense once taxes, risk, timing and other goals are weighed together.
How Much Cash Should You Keep in Reserve?
A common starting point is enough cash and cash equivalents to cover three to six months of essential expenses. The basic liquidity ratio measures where a household stands against that benchmark.
Basic liquidity ratio = Cash and cash equivalents ÷ Monthly expenses (excluding savings and taxes)
Savings contributions and income taxes come out of the expense figure because both would largely stop if income stopped. What’s left is what the household actually needs to keep running.
Suppose a household has $50,000 in cash and spends $15,000 a month on everything else. Its basic liquidity ratio is about 3.3 months.
Whether that’s enough depends on the household. Three months is generally a reasonable floor when two adults earn stable incomes, since one paycheck likely continues if the other stops. Six months fits better with a single earner. A business owner with uneven income or an executive paid largely through bonuses and stock awards may want more. So might anyone expecting a large tax payment or a gap between jobs.
The ratio is useful because it turns a dollar amount into a practical question: How long could you cover your life from what’s readily available?
How Is Cash Flow Different From Net Worth?
Net worth measures financial position at a point in time. Cash flow measures what moves in and out over a period, usually a year, and it often reveals what the balance sheet hides.
Net cash flow = Cash inflows − Cash outflows
Inflows include salary, bonuses, investment income and other receipts. Outflows include living expenses, debt payments, taxes and savings.
This distinction matters a lot for high earners. An executive earning $600,000 a year looks well resourced. But annual compensation and predictable monthly cash flow aren’t the same. Part of that pay may arrive as bonuses or stock awards. Taxes take a substantial share. The mortgage, childcare, tuition and travel may have grown right along with the raises.
A household can earn an impressive amount and keep very little after its obligations. It can also look positive on paper while quietly relying on next year’s bonus or a future stock sale to cover recurring bills. Neither shows up in net worth.
Why Timing Matters
Cash flow isn’t only about annual totals. When money arrives matters too.
Consider a household with steady expenses and uneven income. Annual earnings may comfortably exceed annual spending, yet a property tax bill or tuition payment can land months before the bonus does. That gap calls for a reserve or a deliberate plan.
Approaching retirement changes the question again. Paychecks stop while spending continues, and investment withdrawals, Social Security, pensions and taxes all join the cash flow picture. Good planning accounts for how much money is available and when it will be needed.
Does a High Income Mean You’re Saving Enough?
Not necessarily. The savings ratio compares what a household saves with its gross income, and a common benchmark is at least 10%. Treat that as a floor, not a finish line.
Savings ratio = Savings and investments ÷ Gross income
A household earning $250,000 and saving $50,000 has a 20% savings ratio. A household earning $600,000 and saving $30,000 is at 5%. The first is building flexibility faster relative to income, even though the second earns more than twice as much.
That doesn’t make the first household healthier in every respect. Existing assets, obligations, goals and time horizons can differ a lot. It does show why income alone is an incomplete measure of progress.
For higher earners, recurring expenses deserve extra attention because they’re harder to undo than one-time purchases. A larger home, two car payments, private school tuition and ongoing family support may each be affordable. Together, they can crowd out saving and the ability to respond to change.
This isn’t an argument against enjoying what you’ve worked hard to earn. It’s an argument for seeing the trade-offs clearly, so today’s spending and tomorrow’s priorities can coexist.
When Does Debt Become a Problem?
Debt becomes a problem when the payments, the rate or the risk behind it no longer fit the household’s circumstances. Debt isn’t inherently bad.
A mortgage lets a household buy a home without tying up all its capital. A business owner may borrow to pursue an opportunity. A family may finance a car rather than sell investments at a bad time. Borrowing can be useful. It also creates obligations that must be met whatever happens to income, markets or property values.
A few considerations can change the answer considerably.
The Interest Rate
A low, fixed-rate mortgage and a high-rate credit card balance are different decisions. Paying down expensive debt offers a fairly predictable payoff. With lower-cost debt, the choice usually means weighing interest savings against liquidity, investment opportunities and personal preference.
The Payment Obligation
A household can have enough assets to cover its debts and still struggle with monthly payments if income drops. Debt-to-income ratios show how much of a household’s cash flow is already spoken for (benchmarks in the table below).
Lenders use these ratios to decide how much to lend. A lender approving a loan doesn’t mean the payment fits comfortably within your broader plan. Qualifying for a bigger mortgage and wanting one are two different questions.
The Risk Behind the Collateral
Borrowing against a home or investment portfolio adds risk beyond the interest rate. Collateral values change, some loans carry variable rates, and portfolio-backed loans can require more collateral or repayment if markets fall. That deserves extra scrutiny when the same concentrated asset is also a major source of future wealth.
Your Priorities
Two households with identical balance sheets may make opposite choices about paying off a mortgage. One values the security of owning the house outright. The other prefers a larger portfolio and cash cushion. Both can be reasonable. The right recommendation accounts for what you’re trying to accomplish and what lets you sleep at night.
Which Financial Ratios Should You Pay Attention To?
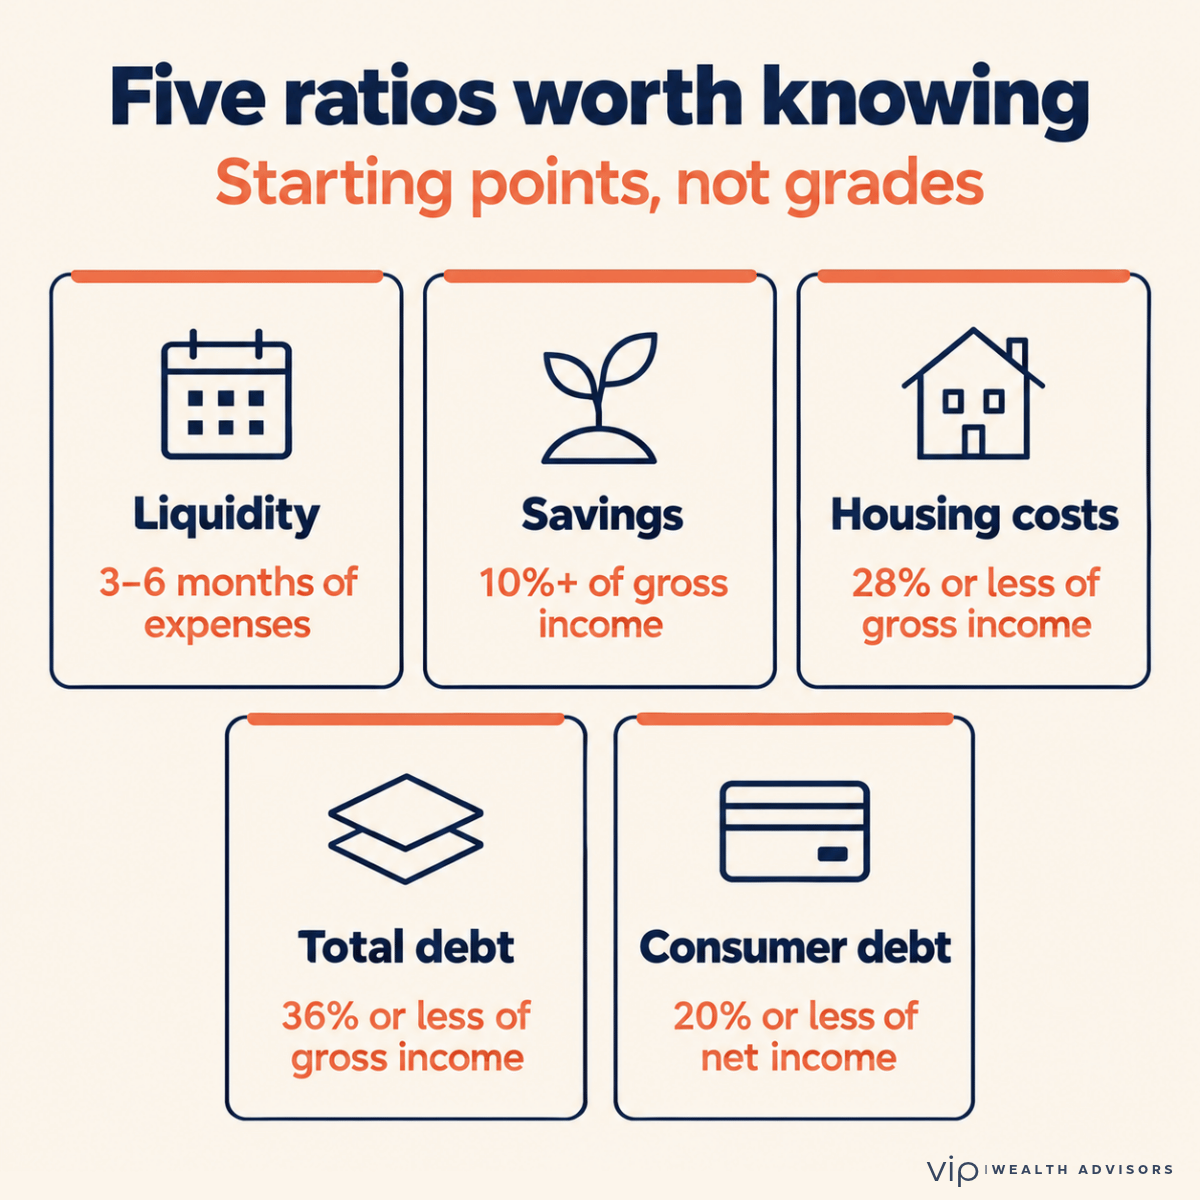
These five ratios cover the core of household financial health. The benchmarks are common starting points used by planners and lenders, not pass-or-fail grades. They’re tools for asking better questions.
Common Benchmarks at a Glance
Planners and lenders use these as starting points. Your own targets depend on your income, goals and the rest of your plan.
| Ratio | What it reveals | Common starting point |
|---|---|---|
| Basic liquidity ratio | Months of expenses covered by cash and cash equivalents | 3–6 months |
| Savings ratio | Share of income directed toward future goals | 10% or more of gross income |
| Housing costs ratio | Share of income committed to principal, interest, property taxes and insurance (PITI) | 28% or less of gross income |
| Total debt ratio | Share of income committed to all debt payments, including housing | 36% or less of gross income |
| Consumer debt ratio | Share of take-home pay going to non-mortgage debt like auto and student loans | 20% or less of net income |
A ratio that looks concerning in isolation may be reasonable once the full picture is clear. The reverse is also true. A household with low debt payments can still have thin reserves if most of its wealth sits in assets that are hard to sell. What matters is how the measures work together, and whether they’re improving or slipping over time.
What Happens When Something Changes?
Back to our $3 million household.
Suppose one spouse decides to leave a demanding corporate role. They’ve talked about it for years, and financially, it looks doable. Their net worth hasn’t gone anywhere. The house, retirement accounts and investments are all still there.
The picture changes anyway. Monthly cash flow may drop. Employer benefits may need replacing. Unvested stock could be forfeited, and vested options may face exercise deadlines. The household may want a bigger cash reserve while the next chapter takes shape. Meanwhile, the mortgage payment and tuition bills don’t change at all.
A plan built around two incomes needs another look, even though the household is still wealthy. The same goes for selling a business, an upcoming IPO, a second home or retiring earlier than expected. Each one reshuffles the relationship between assets, income, spending, debt and liquidity.
As we explored in Part 1 of this series, that’s why a plan works best as an ongoing process rather than a finished document.
Financial Flexibility Is Part of Wealth
Wealth creates opportunities. How that wealth is structured decides which ones you can actually take.
A household with accessible reserves can take time between jobs, help a family member or wait for a better moment to sell an investment. A household with nearly everything tied up in illiquid assets or committed to fixed expenses may have fewer choices, even with a considerably higher net worth.
Neither net worth nor cash flow tells the whole story. They work best read together, alongside debt, taxes, risk, time horizon and personal goals. And those relationships keep shifting.
At VIP Wealth Advisors, a balance sheet and cash flow analysis are a starting point. The real work is understanding what those numbers mean for the decisions you’re making today, and the ones you may face next year.
A strong financial position isn’t just about how much you’ve accumulated. It’s about the choices your wealth allows you to make.
Want a Clearer Picture of Your Financial Life?
If you’ve built significant assets but aren’t sure how your cash flow, investments, debt and goals fit together, that’s a great conversation to have. We look at the whole picture, not just the portfolio.
Frequently Asked Questions
Can you have a high net worth but low liquidity?
Yes. Net worth includes assets like real estate, retirement accounts, business interests and company stock, which can be slow or costly to turn into cash. A household can hold substantial net worth while keeping relatively little available for immediate expenses.
What’s the difference between net worth and cash flow?
Net worth measures assets minus liabilities on a specific date. Cash flow measures money coming in and going out over a period, usually a year. A strong balance sheet doesn’t guarantee a household has enough ongoing cash flow to meet its obligations.
What is the basic liquidity ratio?
The basic liquidity ratio divides cash and cash equivalents by monthly expenses, excluding savings contributions and taxes. The result is the number of months a household could cover expenses if income stopped. Three to six months is a common starting benchmark.
How much cash should a high-net-worth household keep?
There’s no single right amount. Three to six months of essential expenses is a common starting point, but variable income, large upcoming tax bills, concentrated stock and other obligations can justify more. A financial plan can help set a reserve that fits both near-term needs and long-term goals.
What is a good debt-to-income ratio?
Common guidelines are housing costs (principal, interest, taxes and insurance) at or below 28% of gross income, total debt payments at or below 36% of gross income, and non-mortgage consumer debt at or below 20% of net income. Being approved for more doesn’t mean more is comfortable.
Is it better to pay off debt or keep money invested?
It depends on the debt’s rate and terms, the investment’s risk and tax consequences, your liquidity needs and your goals. Paying down high-interest debt is often a priority. Decisions about lower-rate debt, like a mortgage, usually call for a more detailed comparison.